Nova Scotia Solar Case Studies
Real system specs, real NS Power offset numbers, and real 25-year math from projects we have installed across the province.
Actual System Specs, Not Marketing Averages
Every case study on this page follows the same format: the household's starting NS Power bill, the system we designed, and the 25-year financial picture, cash purchase and financed side by side where relevant. Client names are changed for privacy, but the specs, NS Power rates, and savings math reflect real projects.
Three variables move the numbers on any given roof: orientation and shading, the household's current NS Power bill, and whichever municipal financing program applies to that property. We break out all three on every project below.
Recent Installations
Sunnybrook Residence, Bedford →
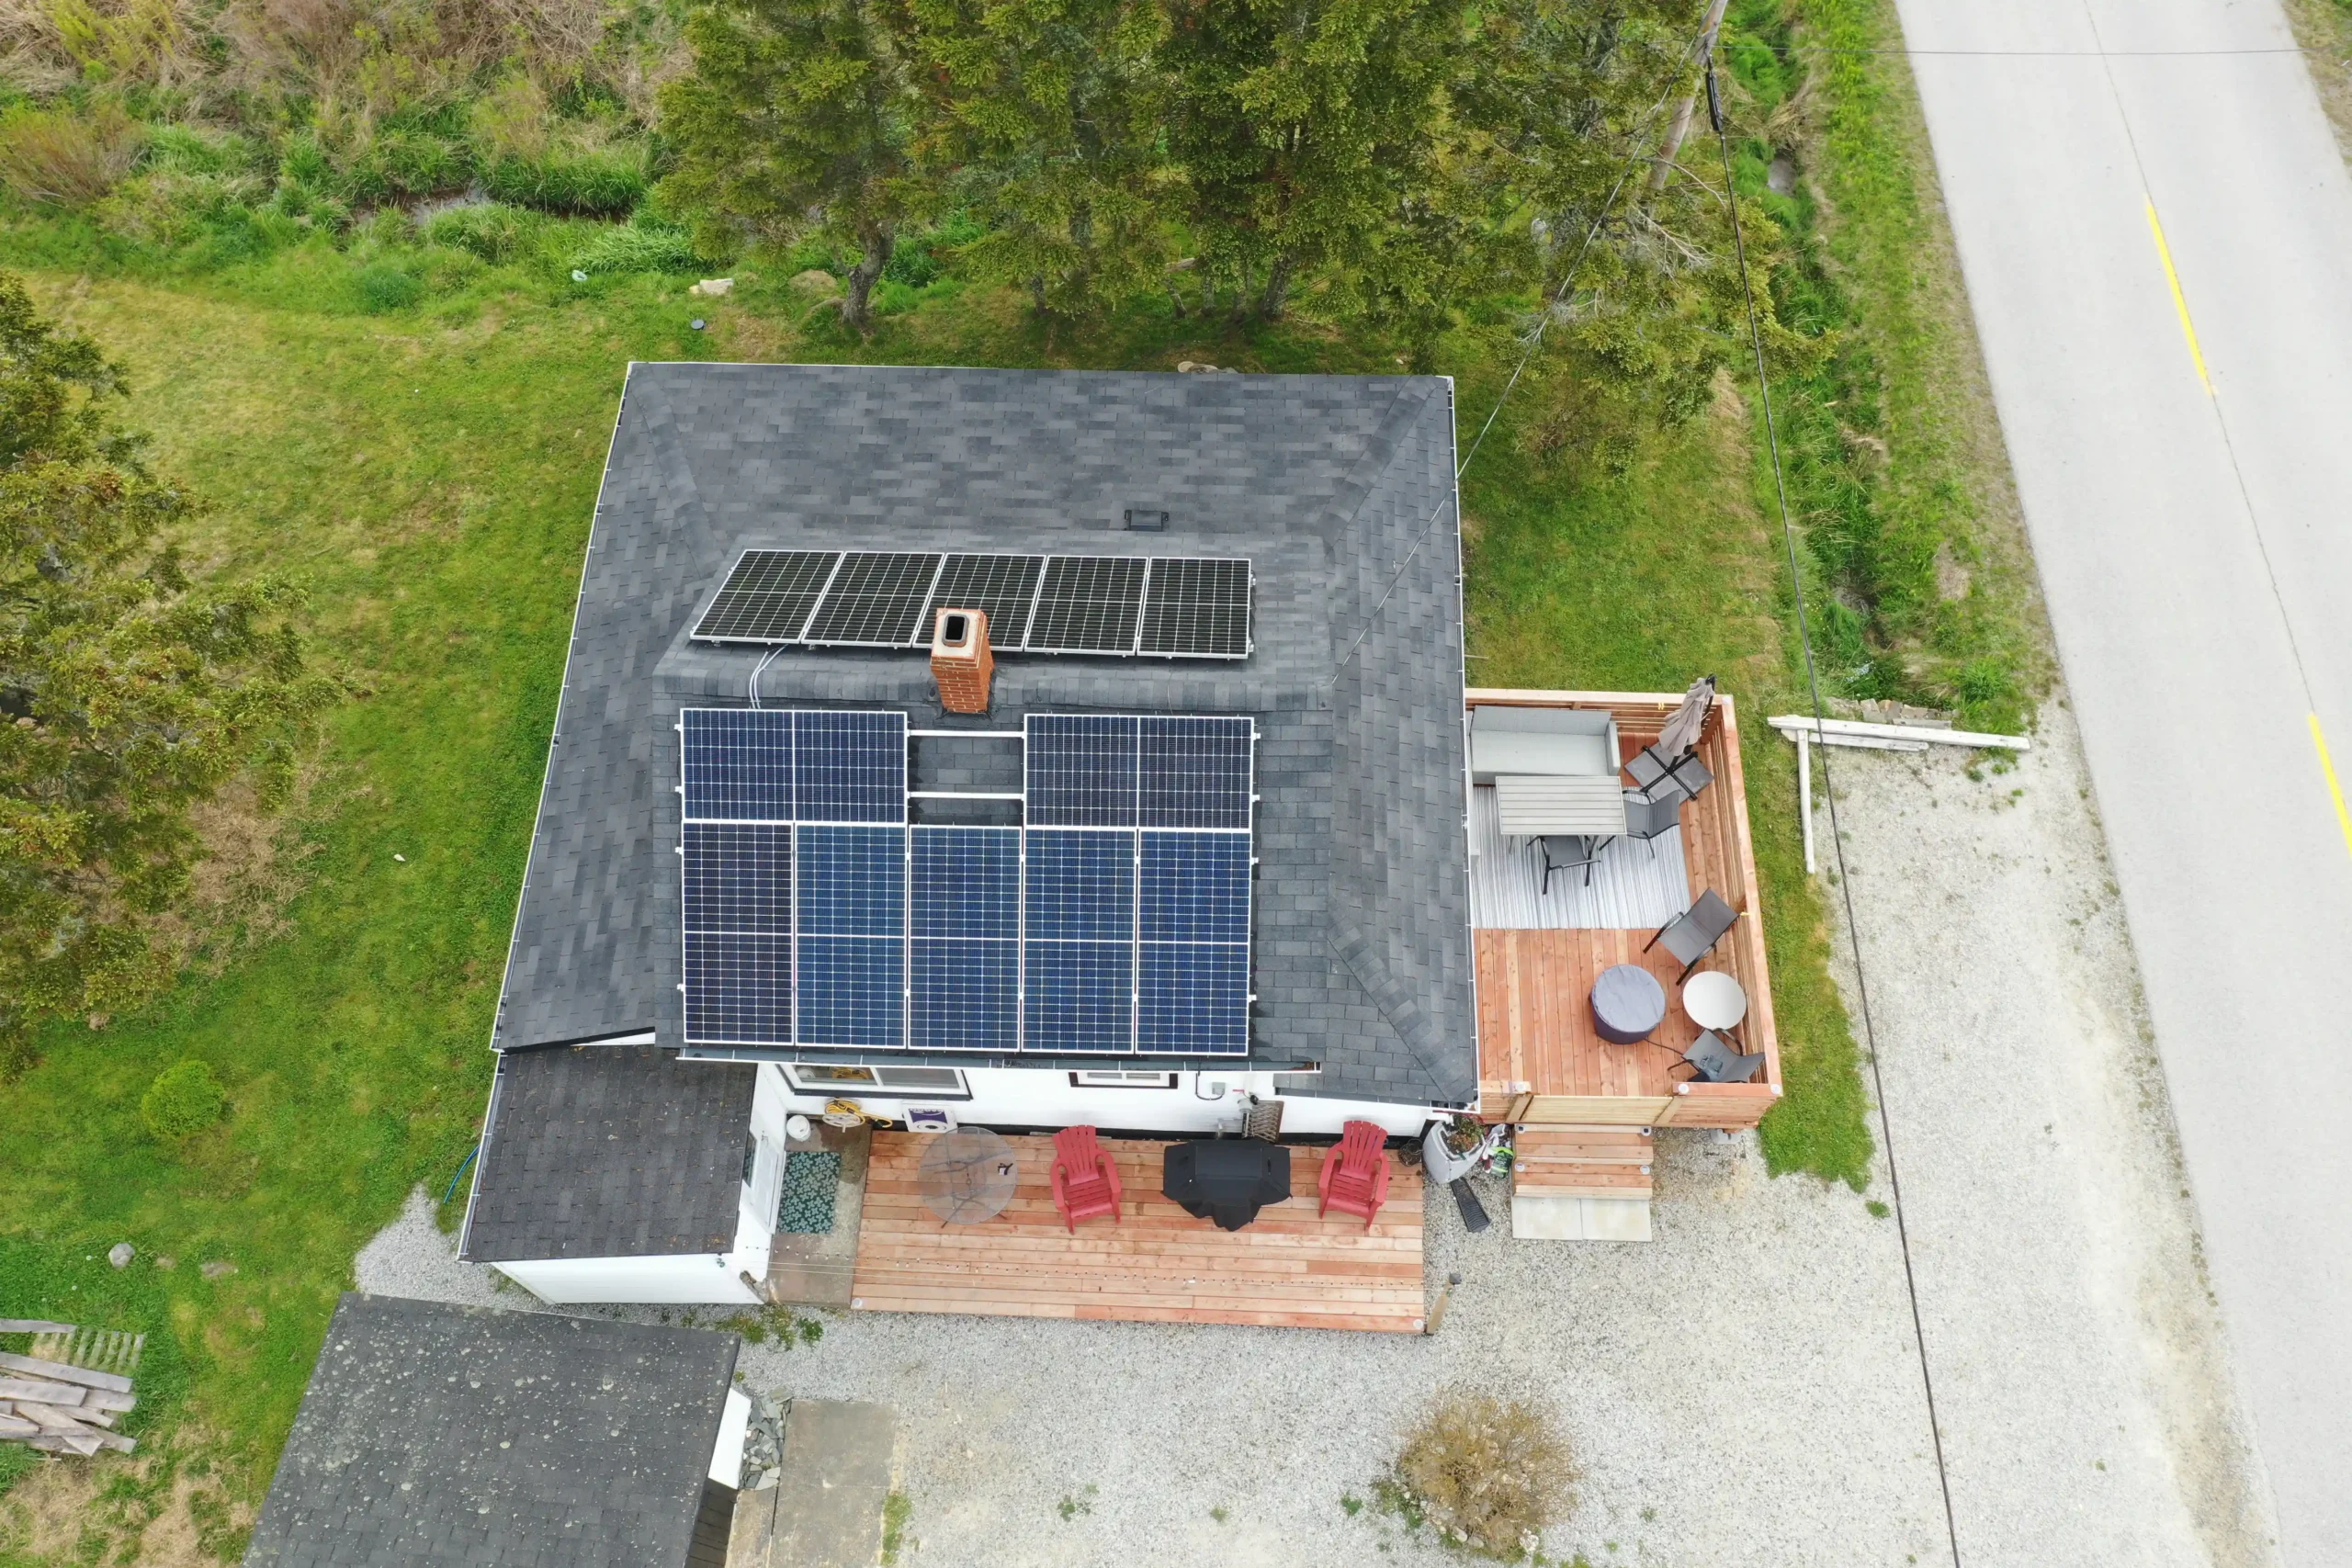
8.4 kW rooftop system, 71% offset, Solar City PACE comparison included.
Atlantic Tech Office, Halifax →
42 kW commercial rooftop array, 79% offset, with federal ITC savings included.
Greenfields Farm →
Hybrid solar and battery system providing reliable backup power on a working farm.
Three Variables That Change Every Quote
Roof Orientation and Shading
A clean south-facing slope with no tree cover produces meaningfully more than a partially shaded east or west roof of the same size.
Your Current NS Power Bill
Higher baseline usage generally supports a larger system and a faster payback, since more of the array's output directly displaces retail electricity.
Your Municipality's Financing Terms
Solar City, Bridgewater Clean Energy Financing, and CBRM's program each carry different rates and terms that change the cash flow math.
How to Compare a Case Study to Your Own Property
No two Nova Scotia properties produce identical numbers, even at the same system size. A Bedford rooftop with a clean south-facing slope and a Cape Breton property on a rural feeder with frequent outages start from very different baselines, one optimizing for offset percentage, the other for backup reliability. Use the case studies here as a reference for the kind of math involved, not a direct prediction for your own address.
The financing scenario matters just as much as the system itself. A cash-purchase system and the same system financed through Solar City or a local PACE program will show different monthly cash flow and slightly different net 25-year savings, even though the underlying solar production is identical. We break out both scenarios wherever relevant so you can see the actual tradeoff rather than a single blended number.
Want a Custom Case Study for Your Property?
Send us a recent NS Power bill. We will model your specific roof and financing options and put together numbers like the ones above.
Get Your Free Estimate